1. Starting Point: Random Data
We'll use 50 random points to demonstrate each parameter:
import numpy as np
from pyinla.fmesher import fm_mesh_2d

np.random.seed(42)
locs = np.random.randn(50, 2)  # 50 random points
Let's visualize the raw data points before creating any mesh:
import matplotlib.pyplot as plt

fig, ax = plt.subplots(figsize=(7, 7))
ax.scatter(locs[:, 0], locs[:, 1], c='red', s=50, edgecolor='white', linewidth=0.8)
ax.set_aspect('equal')
ax.set_title(f"50 Random Data Points")
ax.grid(True, alpha=0.3)
plt.show()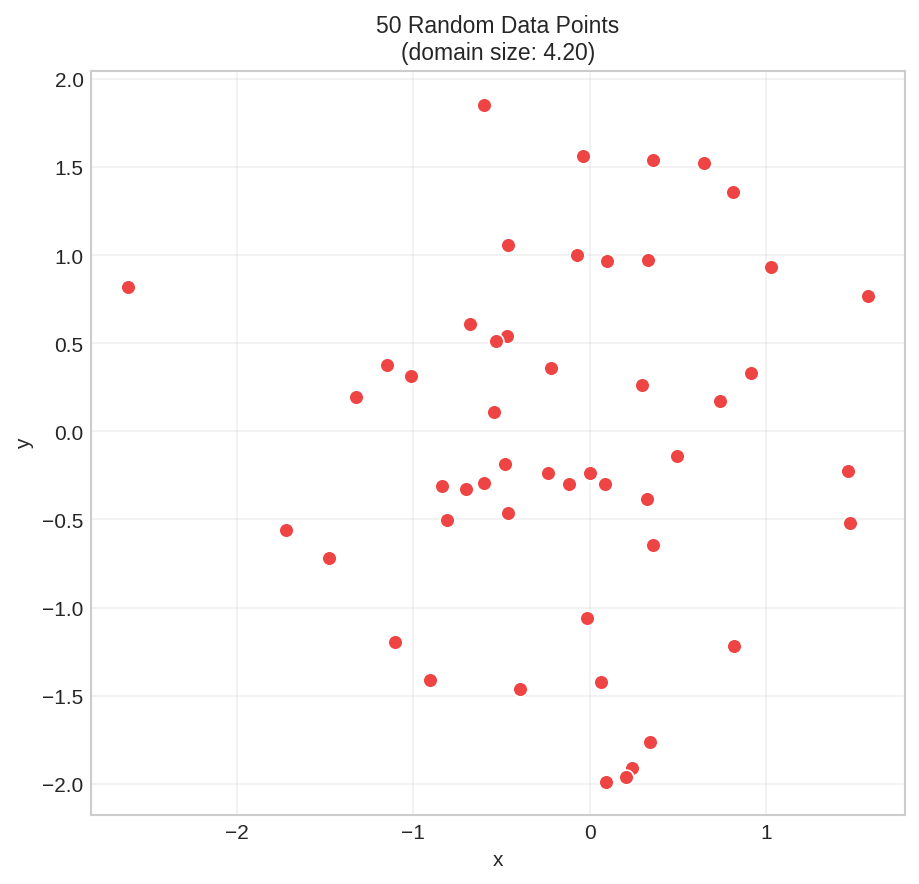
These are our data points. The domain size (width/height) is about 4.2 units. Now let's create a mesh.
2. Domain Size & Minimal Mesh
First, calculate your domain size - you'll need it to set parameters:
# Domain size = the larger of width or height
x_range = locs[:, 0].max() - locs[:, 0].min()  # width
y_range = locs[:, 1].max() - locs[:, 1].min()  # height
domain_size = max(x_range, y_range)

print(domain_size)The simplest mesh just uses the convex hull of your data:
# Simplest possible mesh - no parameters
mesh = fm_mesh_2d(loc=locs)

print(mesh.summary())Manifold: R2
Vertices: 112
Triangles: 189
Edges: 300
x range: [-2.8297, 1.7892]
y range: [-2.1975, 2.0622]
z range: [0.0000, 0.0000]
CRS: Coordinate Reference System: NA
Every FmMesh has a built-in plot() method:
mesh.plot(locs=locs, title="Minimal mesh")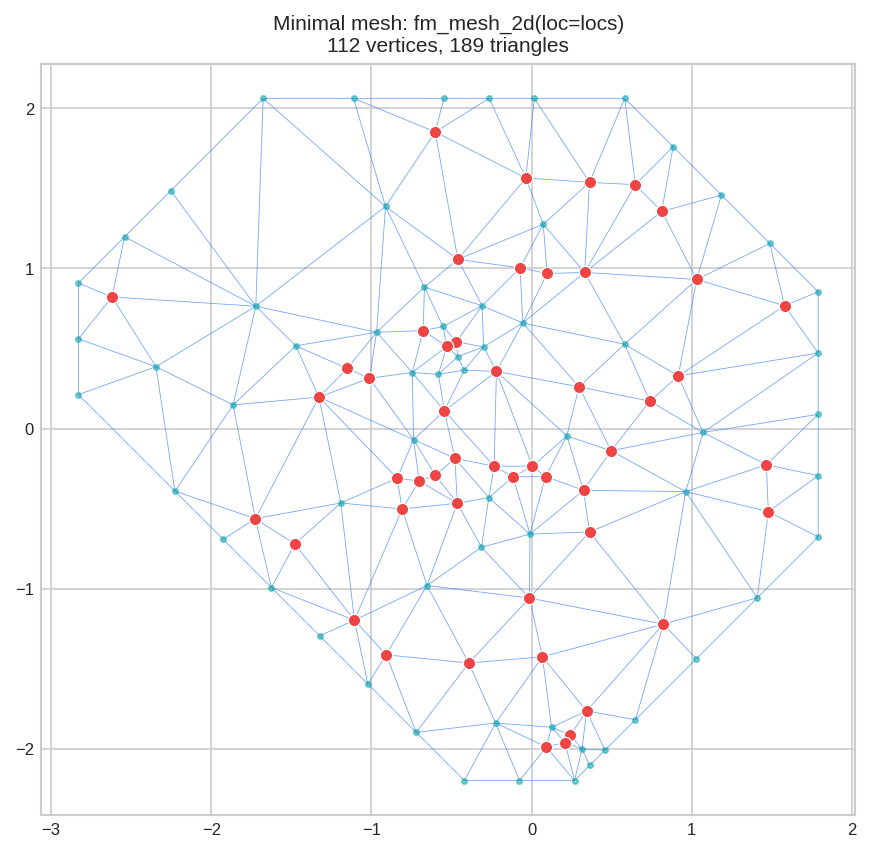
Red dots = data points. Blue lines = mesh triangles. Teal dots = mesh vertices. The outer boundary follows the convex hull. Problem: No control over triangle size, no extension beyond data.
max_edge=0.5 is fine for domain size 4, but too large for domain size 0.1.
3. Parameter: max_edge - Triangle Size
max_edge = Maximum allowed edge length. Smaller = finer mesh, more triangles, more computation.
import matplotlib.pyplot as plt

# Compare different max_edge values
mesh_coarse = fm_mesh_2d(loc=locs, max_edge=1.5)   # Large triangles
mesh_medium = fm_mesh_2d(loc=locs, max_edge=0.5)   # Medium triangles
mesh_fine   = fm_mesh_2d(loc=locs, max_edge=0.2)   # Small triangles

# Plot side by side using the ax parameter
fig, axes = plt.subplots(1, 3, figsize=(14, 4.5))
mesh_coarse.plot(locs=locs, ax=axes[0], title="max_edge=1.5", show=False)
mesh_medium.plot(locs=locs, ax=axes[1], title="max_edge=0.5", show=False)
mesh_fine.plot(locs=locs, ax=axes[2], title="max_edge=0.2", show=False)
plt.tight_layout()
plt.show()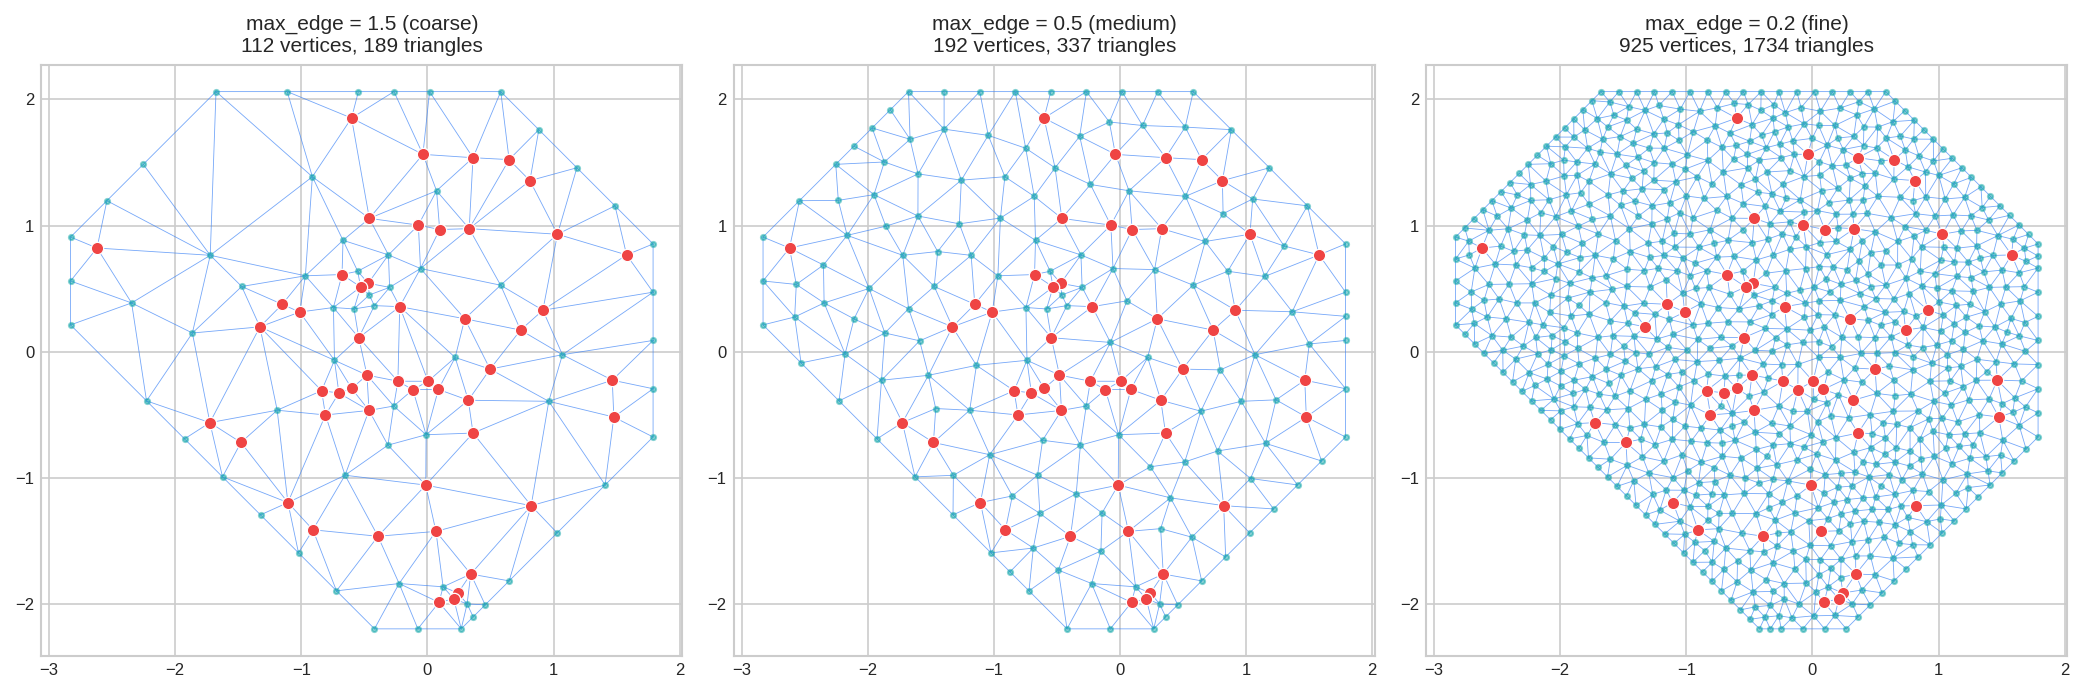
max_edge as 5-15% of domain size.For domain size 4.2: use 0.2 (5%) to 0.6 (15%).
4. Parameter: offset - Boundary Extension
offset = Extends mesh beyond your data points. Essential for SPDE models to avoid boundary artifacts.
# Compare different offset values
mesh_no_ext    = fm_mesh_2d(loc=locs, max_edge=0.5)                  # No extension
mesh_small_ext = fm_mesh_2d(loc=locs, max_edge=0.5, offset=0.5)    # Small buffer
mesh_large_ext = fm_mesh_2d(loc=locs, max_edge=0.5, offset=1.5)    # Large buffer

fig, axes = plt.subplots(1, 3, figsize=(14, 4.5))
mesh_no_ext.plot(locs=locs, ax=axes[0], title="No offset", show=False)
mesh_small_ext.plot(locs=locs, ax=axes[1], title="offset=0.5", show=False)
mesh_large_ext.plot(locs=locs, ax=axes[2], title="offset=1.5", show=False)
plt.tight_layout()
plt.show()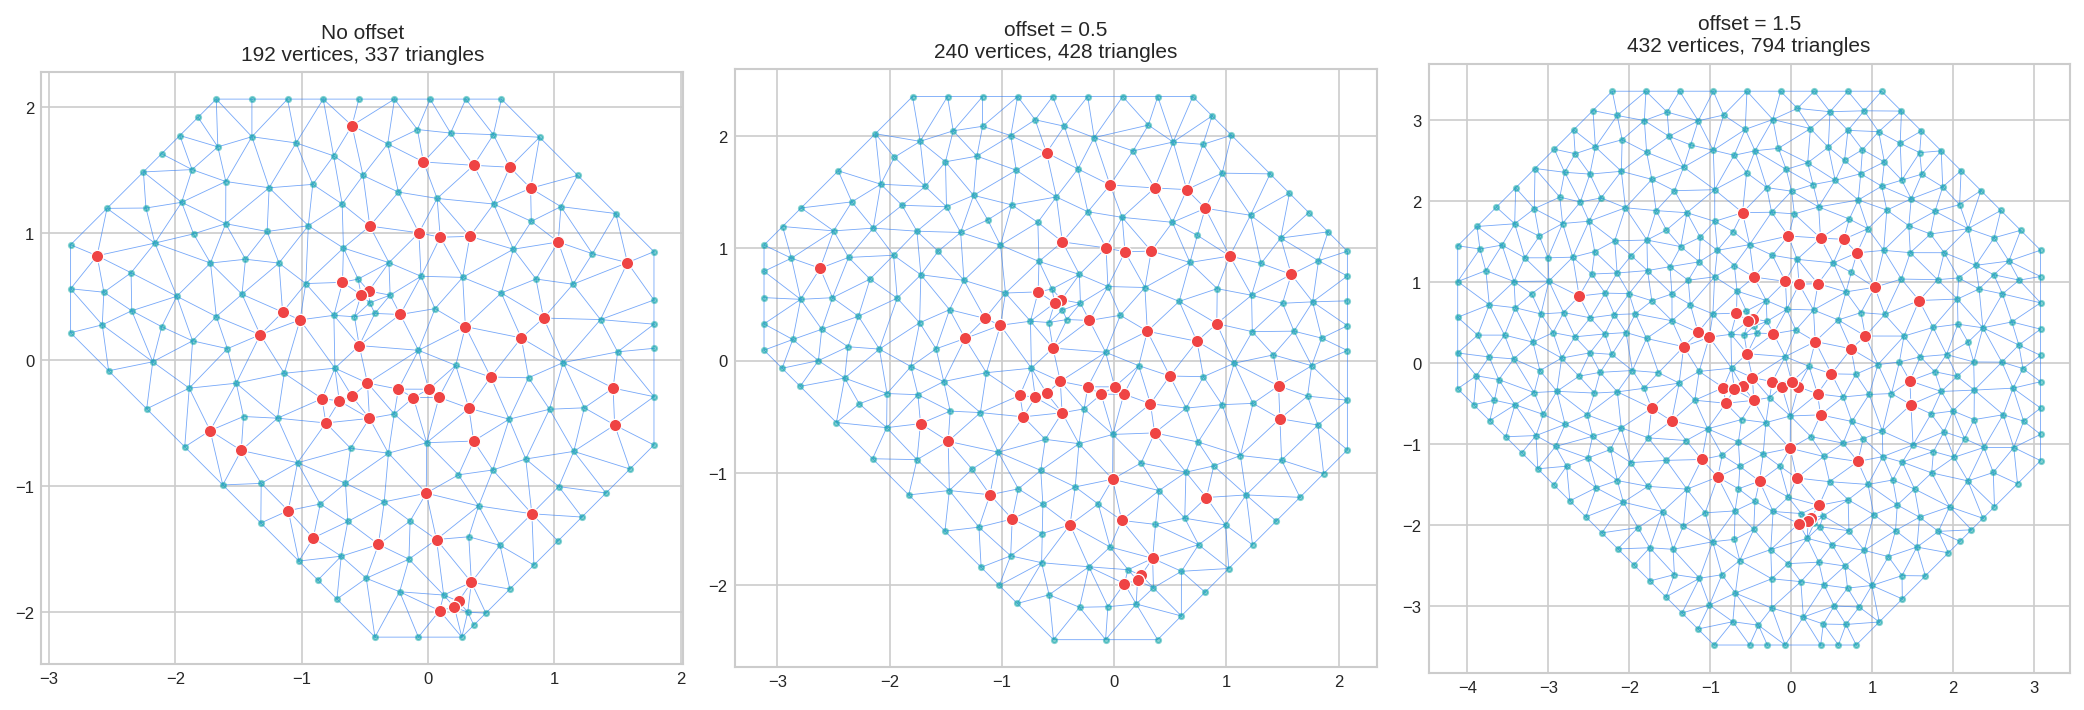
offset=-0.1 means 10% of data diameter.
5. Inner vs Outer Zones: [inner, outer]
Parameters can take two values to control the inner (near data) and outer (extension) regions separately:
# Uniform resolution everywhere
mesh_uniform = fm_mesh_2d(loc=locs, max_edge=0.4, offset=1.5)

# Fine near data, coarse in extension (saves computation!)
mesh_varying = fm_mesh_2d(loc=locs, max_edge=[0.25, 0.8], offset=1.5)

print(f"Uniform: {mesh_uniform.n} vertices")
print(f"Varying: {mesh_varying.n} vertices")Varying: 1764 vertices
fig, axes = plt.subplots(1, 2, figsize=(12, 5))
mesh_uniform.plot(locs=locs, ax=axes[0], title="max_edge=0.4 (uniform)", show=False)
mesh_varying.plot(locs=locs, ax=axes[1], title="max_edge=[0.25, 0.8]", show=False)
plt.tight_layout()
plt.show()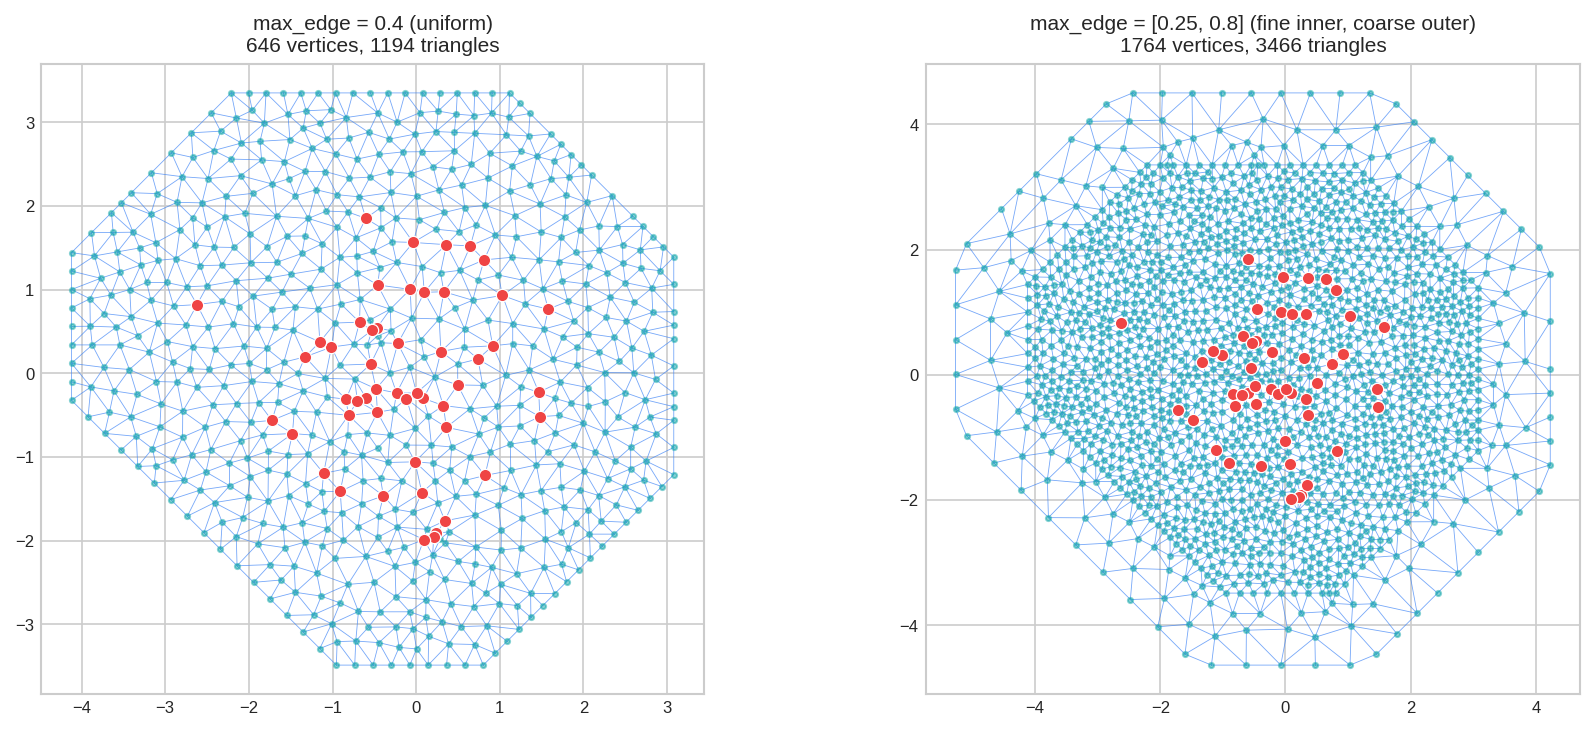
[inner, outer] gives you accuracy where your data is, without wasting vertices in the buffer zone.
6. Parameter: cutoff - Point Merging
cutoff = Minimum distance between vertices. Points closer than this are merged together.
Essential when your data has clusters (tight groups of points):
# Data with a tight cluster
locs_clustered = np.vstack([
    np.random.randn(30, 2),                      # Spread points
    np.random.randn(20, 2) * 0.15 + [0.5, 0.5]  # Tight cluster
])

mesh_no_cutoff = fm_mesh_2d(loc=locs_clustered, max_edge=0.4)
mesh_cutoff    = fm_mesh_2d(loc=locs_clustered, max_edge=0.4, cutoff=0.1)
mesh_cutoff_lg = fm_mesh_2d(loc=locs_clustered, max_edge=0.4, cutoff=0.25)

print(f"No cutoff: {mesh_no_cutoff.n} vertices")
print(f"cutoff=0.1: {mesh_cutoff.n} vertices")
print(f"cutoff=0.25: {mesh_cutoff_lg.n} vertices")cutoff=0.1: 247 vertices
cutoff=0.25: 228 vertices
fig, axes = plt.subplots(1, 3, figsize=(14, 4.5))
mesh_no_cutoff.plot(locs=locs_clustered, ax=axes[0], title="No cutoff", show=False)
mesh_cutoff.plot(locs=locs_clustered, ax=axes[1], title="cutoff=0.1", show=False)
mesh_cutoff_lg.plot(locs=locs_clustered, ax=axes[2], title="cutoff=0.25", show=False)
plt.tight_layout()
plt.show()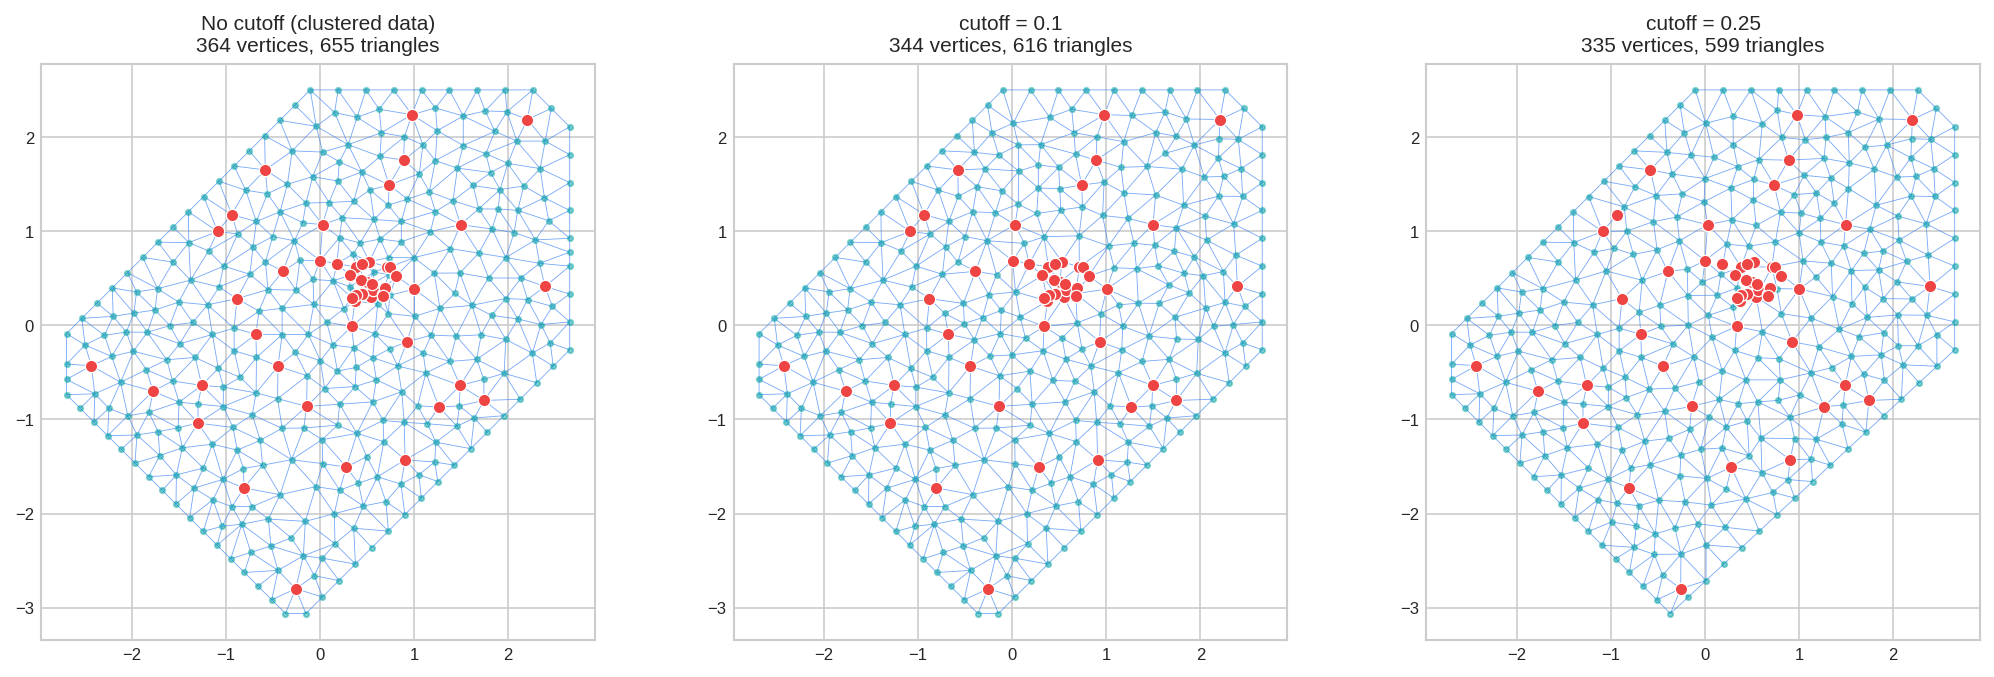
7. Parameter: min_angle - Triangle Quality
min_angle = Minimum interior angle (degrees). Higher = better-shaped triangles.
mesh_low  = fm_mesh_2d(loc=locs, max_edge=0.5, min_angle=10)   # Allows skinny
mesh_def  = fm_mesh_2d(loc=locs, max_edge=0.5, min_angle=21)   # Default
mesh_high = fm_mesh_2d(loc=locs, max_edge=0.5, min_angle=30)   # High quality

print(f"min_angle=10: {mesh_low.n} vertices, {mesh_low.n_triangle} triangles")
print(f"min_angle=21: {mesh_def.n} vertices, {mesh_def.n_triangle} triangles")
print(f"min_angle=30: {mesh_high.n} vertices, {mesh_high.n_triangle} triangles")min_angle=21: 192 vertices, 337 triangles
min_angle=30: 267 vertices, 484 triangles
fig, axes = plt.subplots(1, 3, figsize=(14, 4.5))
mesh_low.plot(locs=locs, ax=axes[0], title="min_angle=10", show=False)
mesh_def.plot(locs=locs, ax=axes[1], title="min_angle=21 (default)", show=False)
mesh_high.plot(locs=locs, ax=axes[2], title="min_angle=30", show=False)
plt.tight_layout()
plt.show()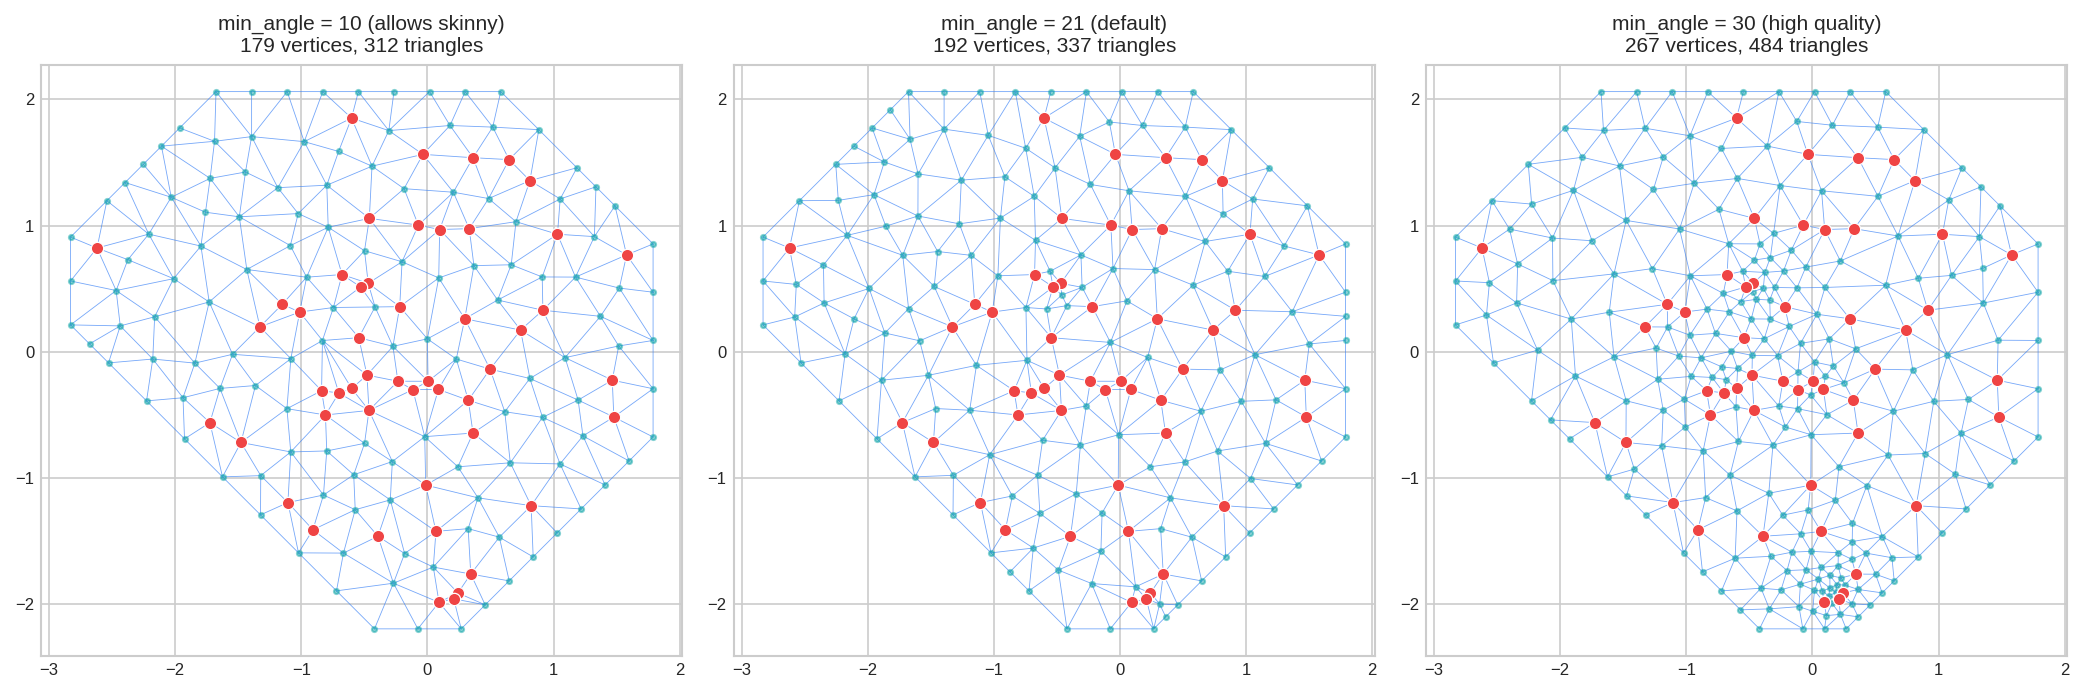
Range: 21-30° recommended. Maximum practical: ~33°.
8. Parameter: boundary - Custom Shapes
Use fm_segm() to create custom boundary polygons instead of the convex hull:
from pyinla.fmesher import fm_segm

# Square boundary
square = np.array([[-3, -3], [3, -3], [3, 3], [-3, 3]])
boundary_sq = fm_segm(square, is_bnd=True)

# L-shaped boundary
L_shape = np.array([[-3, -3], [3, -3], [3, 0], [0, 0], [0, 3], [-3, 3]])
boundary_L = fm_segm(L_shape, is_bnd=True)

mesh_convex = fm_mesh_2d(loc=locs, max_edge=0.5)                          # Default convex hull
mesh_square = fm_mesh_2d(loc=locs, boundary=boundary_sq, max_edge=0.5)
mesh_L      = fm_mesh_2d(loc=locs, boundary=boundary_L, max_edge=0.5)

fig, axes = plt.subplots(1, 3, figsize=(14, 4.5))
mesh_convex.plot(locs=locs, ax=axes[0], title="Default (convex hull)", show=False)
mesh_square.plot(locs=locs, ax=axes[1], title="Square boundary", show=False)
mesh_L.plot(locs=locs, ax=axes[2], title="L-shaped boundary", show=False)
plt.tight_layout()
plt.show()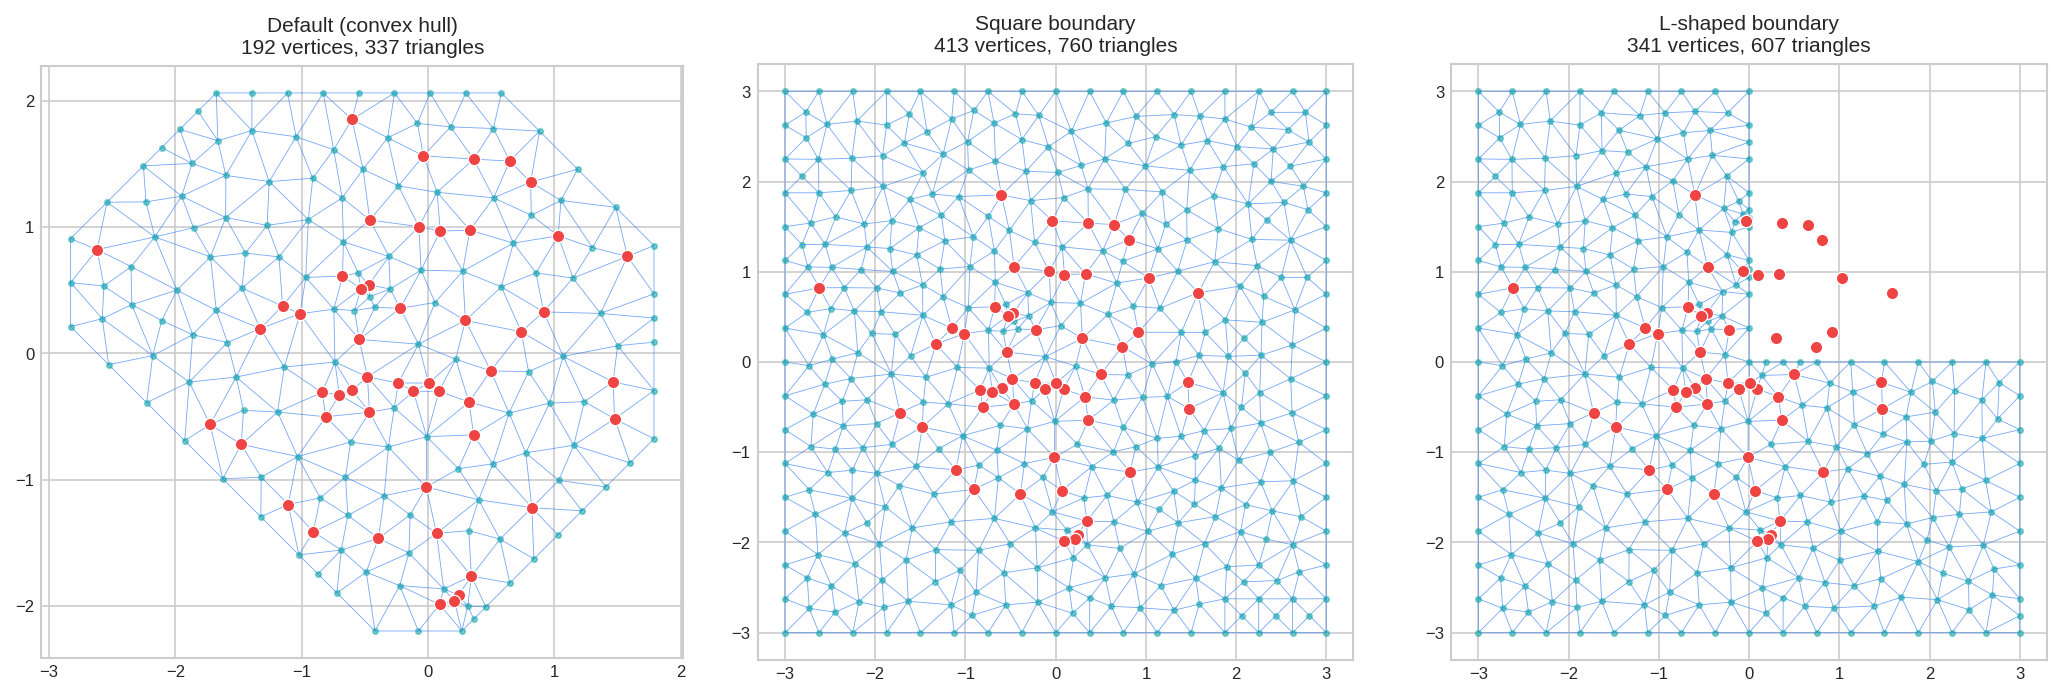
9. Complete Example: Putting It Together
Here's a well-configured mesh for SPDE modeling, with parameters based on domain size:
# Calculate domain size first
domain_size = max(
    locs[:, 0].max() - locs[:, 0].min(),
    locs[:, 1].max() - locs[:, 1].min()
)

# Build mesh with parameters relative to domain size
mesh = fm_mesh_2d(
    loc=locs,
    offset=[0.1 * domain_size, 0.35 * domain_size],   # 10%, 35% extension
    max_edge=[0.08 * domain_size, 0.3 * domain_size],  # 8%, 30% triangle size
    cutoff=0.04 * domain_size,                          # 4% minimum spacing
    min_angle=21                                        # Good triangle quality
)

print(mesh.summary())Manifold: R2
Vertices: 492
Triangles: 952
Edges: 1443
x range: [-4.5093, 3.4687]
y range: [-3.8028, 3.7418]
z range: [0.0000, 0.0000]
CRS: Coordinate Reference System: NA
mesh.plot(locs=locs, title="Optimized mesh for SPDE modeling")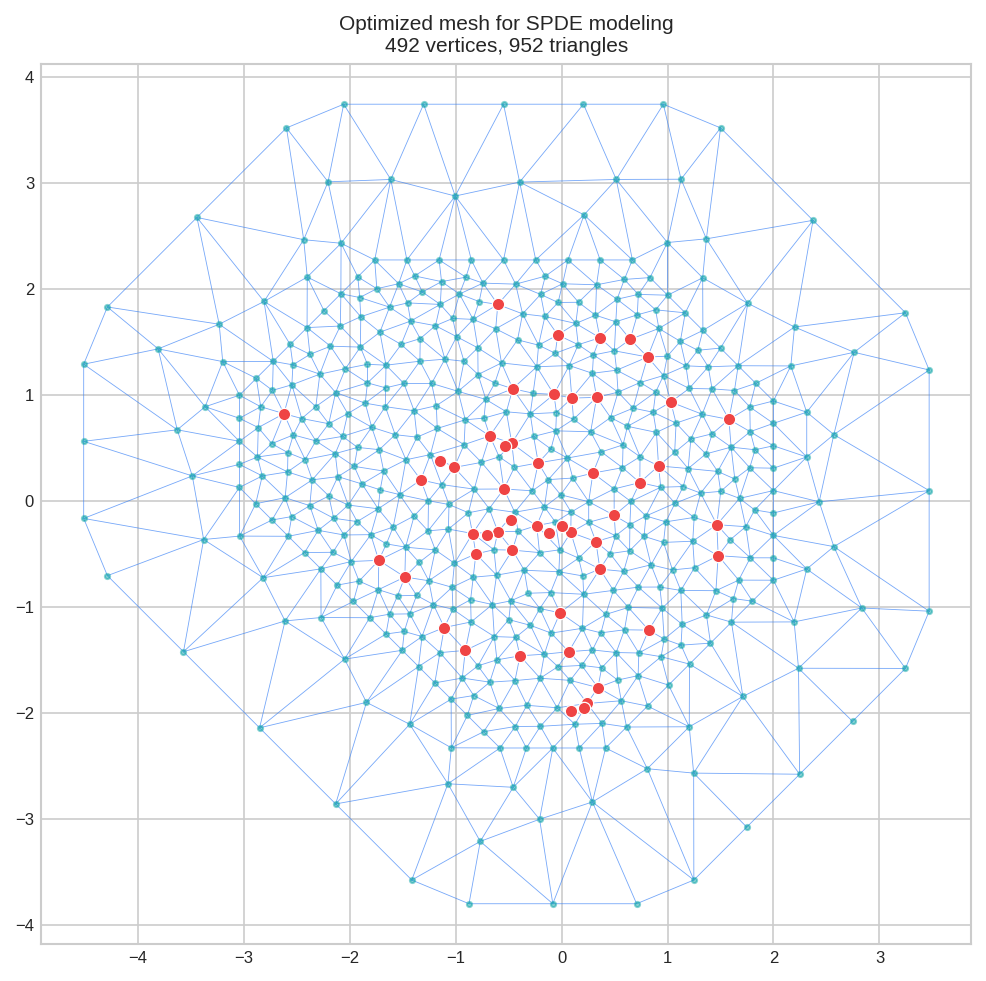
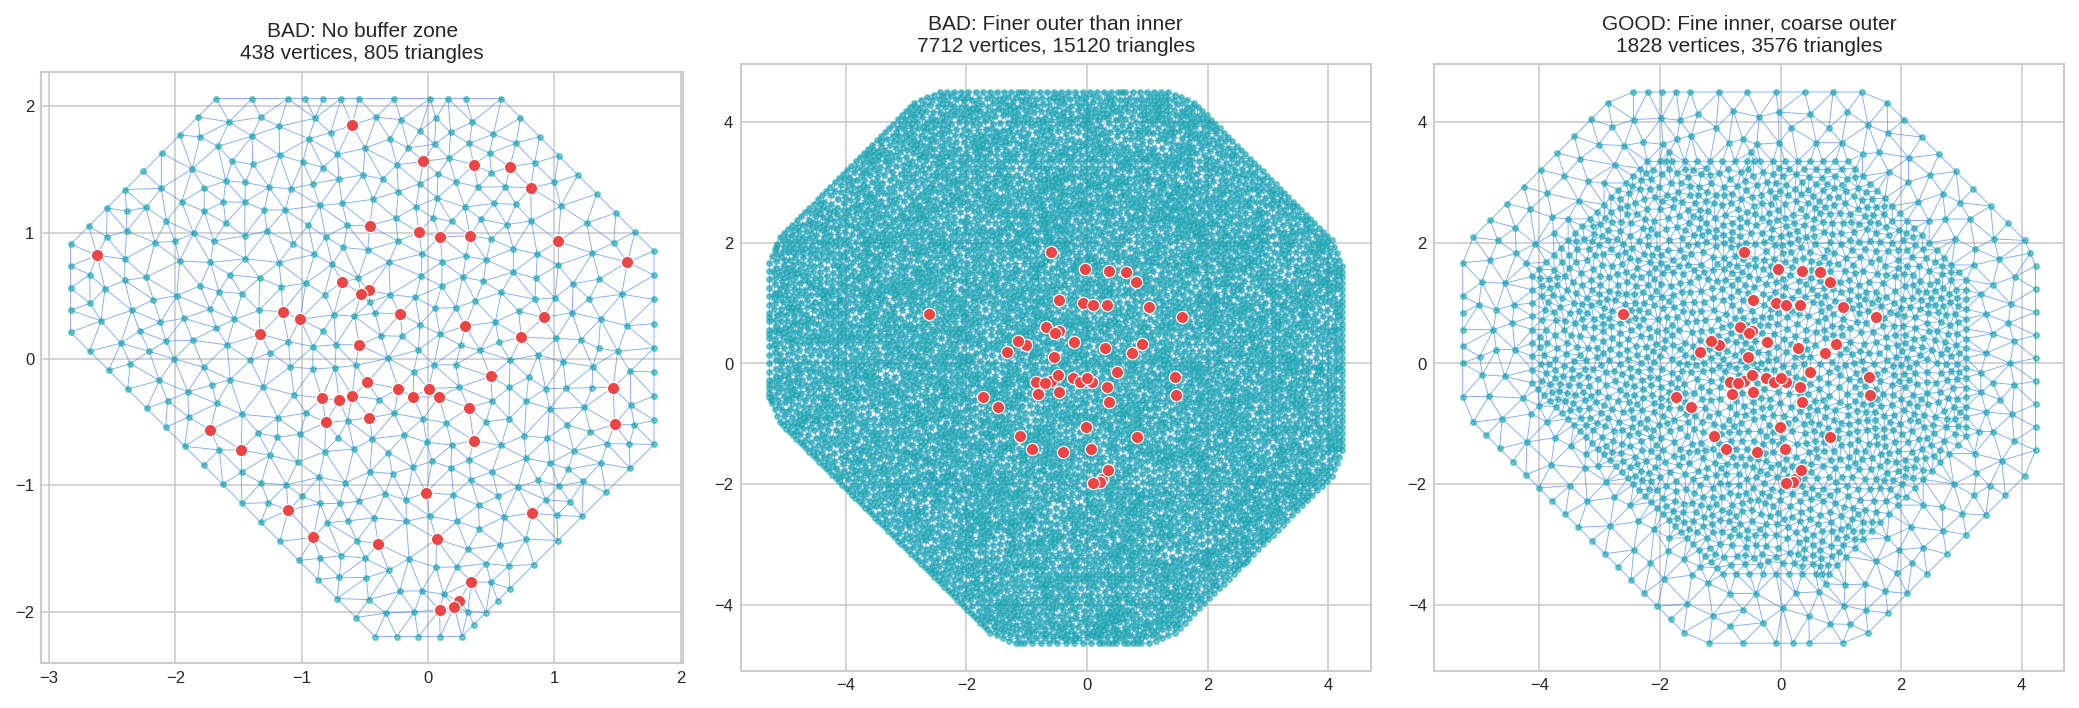
Common Mistakes to Avoid
Poor mesh choices can make INLA run significantly slower and use much more memory. Watch out for:
| Mistake | Problem | Solution |
|---|---|---|
| No outer buffer | Boundary artifacts corrupt estimates near edges | Add offset parameter |
| Buffer too small | Boundary effects still reach your data | Use offset of 20-35% of domain size |
| Same resolution everywhere | Wastes computation on the buffer zone | Use max_edge=[fine, coarse] |
| Finer outer than inner | Illogical and extremely wasteful | Outer max_edge should be larger than inner |
| Clustered data without cutoff | Creates degenerate triangles, numerical issues | Set cutoff to merge close points |
Quick Reference
| Parameter | Type | What It Does | Suggested Value |
|---|---|---|---|
loc |
array (n, 2) | Data point locations | Required |
max_edge |
float or [in, out] | Maximum triangle edge length | 5-15% of domain |
offset |
float or [in, out] | Extension beyond data | 10-35% of domain |
cutoff |
float | Merges close points | 3-5% of domain |
min_angle |
float | Minimum triangle angle | 21-30° |
boundary |
FmSegment | Custom boundary shape | Optional |