Gallery
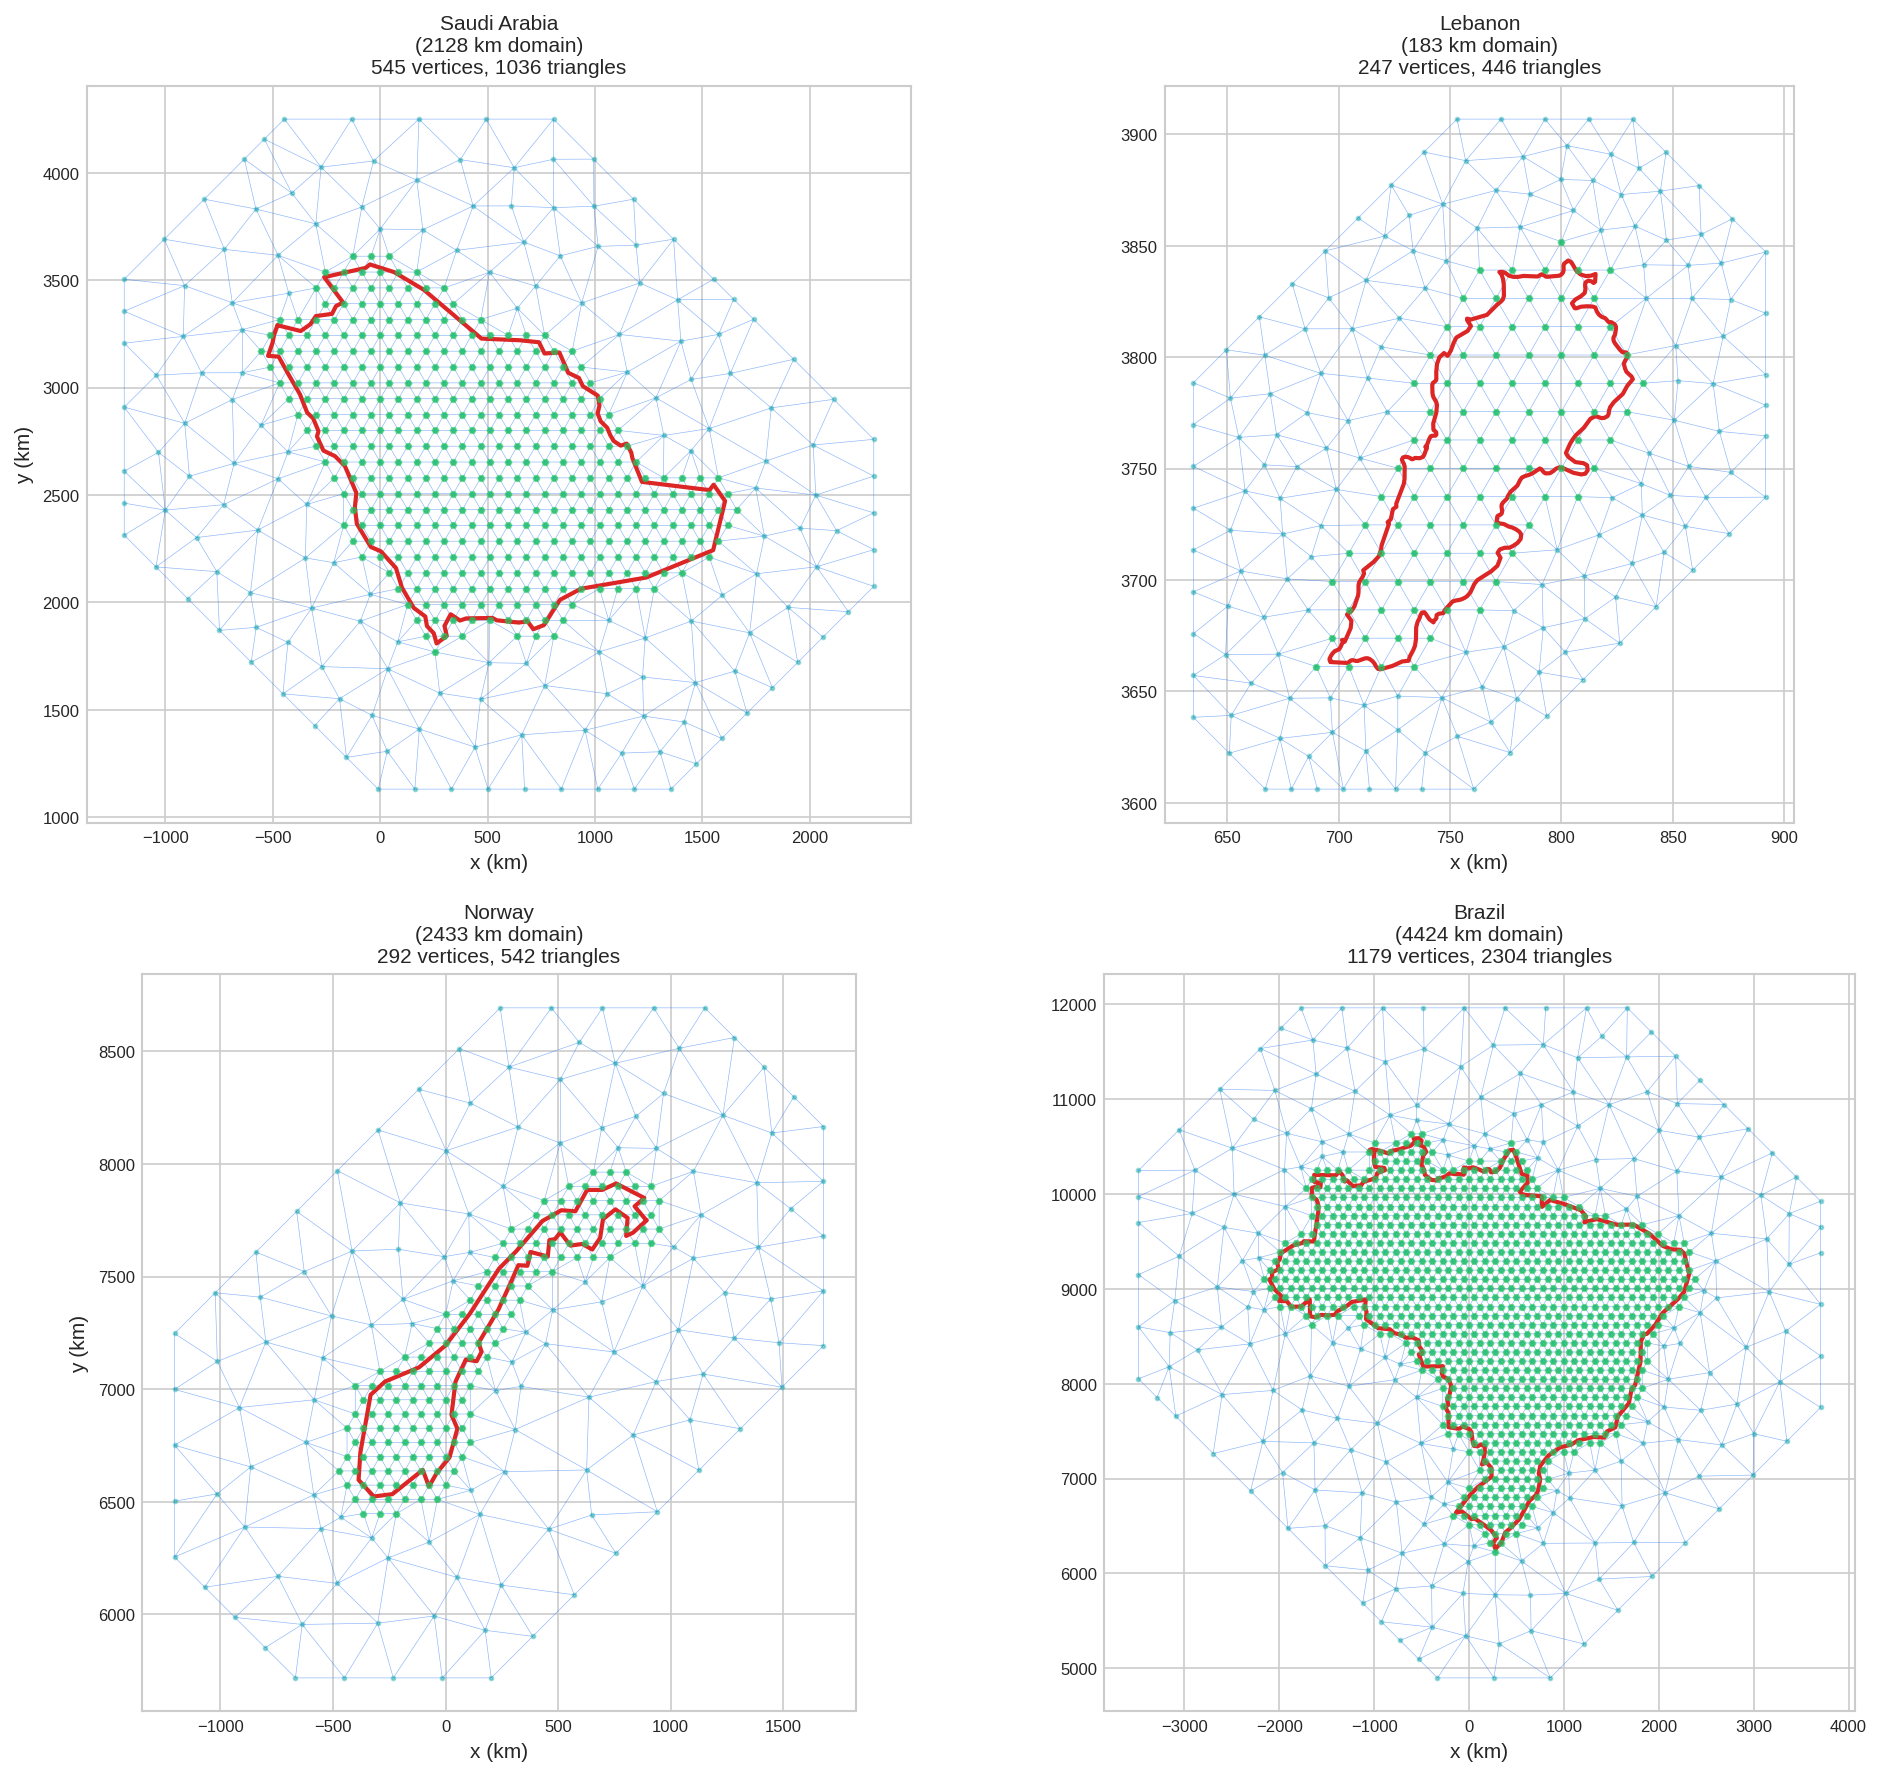
Here are example meshes for countries with different geographic characteristics:
Loading Any Country Boundary
Use Natural Earth data to get boundaries for any country. Here's a reusable function:
import numpy as np
import geopandas as gpd
import matplotlib.pyplot as plt
from pyinla.fmesher import fm_mesh_2d, fm_hexagon_lattice

def load_country_boundary(country_name, resolution='auto'):
    """Load country boundary from Natural Earth data.

    Parameters
    ----------
    country_name : str
        Country name (e.g., 'Saudi Arabia', 'Norway', 'Brazil')
    resolution : str
        '110m' (coarse), '50m' (medium), '10m' (fine), or 'auto'
        'auto' selects based on country size

    Returns
    -------
    geopandas.GeoDataFrame
        Country boundary in its appropriate UTM projection (in km)
    """
    # Auto-select resolution based on country size
    if resolution == 'auto':
        url_110m = 'https://naciscdn.org/naturalearth/110m/cultural/ne_110m_admin_0_countries.zip'
        world_110m = gpd.read_file(url_110m)
        country_check = world_110m[world_110m['ADMIN'] == country_name]
        bounds = country_check.total_bounds
        size_deg = max(bounds[2] - bounds[0], bounds[3] - bounds[1])
        resolution = '10m' if size_deg < 5 else '50m' if size_deg < 15 else '110m'

    # Load Natural Earth data
    url = f'https://naciscdn.org/naturalearth/{resolution}/cultural/ne_{resolution}_admin_0_countries.zip'
    world = gpd.read_file(url)
    country = world[world['ADMIN'] == country_name]

    if len(country) == 0:
        raise ValueError(f"Country '{country_name}' not found")

    # Get UTM zone from representative point
    repr_point = country.geometry.representative_point().iloc[0]
    utm_zone = int((repr_point.x + 180) / 6) + 1

    # Project to UTM directly in kilometers
    country_km = country.to_crs(f"+proj=utm +zone={utm_zone} +units=km")

    return country_km
# Example usage:
saudi = load_country_boundary('Saudi Arabia') # Uses 110m (large)
lebanon = load_country_boundary('Lebanon') # Uses 10m (small)
brazil = load_country_boundary('Brazil') # Uses 110m (large)10m for small countries (<500 km), 50m for medium, 110m for large. Small countries like Lebanon need higher resolution for accurate boundaries.
Extracting Boundary Coordinates
Once you have the GeoDataFrame, extract coordinates for meshing:
def get_boundary_coords(gdf):
    """Extract boundary coordinates from a GeoDataFrame.

    Handles both Polygon and MultiPolygon geometries.
    For MultiPolygon, returns the largest polygon.
    """
    geometry = gdf.geometry.iloc[0]

    if geometry.geom_type == 'MultiPolygon':
        # Get the largest polygon
        largest = max(geometry.geoms, key=lambda p: p.area)
        coords = np.array(largest.exterior.coords)[:-1]
    else:
        coords = np.array(geometry.exterior.coords)[:-1]

    return coords

# Example
boundary = get_boundary_coords(saudi)
print(f"Boundary has {len(boundary)} points")Country Examples
Saudi Arabia
Large country with mostly convex shape. Using hexagon lattice for uniform interior resolution.
saudi = load_country_boundary('Saudi Arabia')
boundary = get_boundary_coords(saudi)
bounds = saudi.total_bounds
domain_size = max(bounds[2] - bounds[0], bounds[3] - bounds[1])

# Generate hexagon lattice points inside boundary
edge_len = 0.04 * domain_size  # ~85 km spacing
geo_buffer = 0.05 * domain_size
hex_points = fm_hexagon_lattice(boundary, edge_len=edge_len, geo_buffer=geo_buffer)

# Create mesh from hexagon points
mesh = fm_mesh_2d(
    loc=hex_points,
    offset=0.3 * domain_size,
    max_edge=0.15 * domain_size
)
print(f"Domain: {domain_size:.0f} km, Mesh: {mesh.n} vertices")

# Plot mesh with country border
fig, ax = mesh.plot(title="Saudi Arabia", show=False)
saudi.boundary.plot(ax=ax, color='red', linewidth=2)
ax.scatter(hex_points[:, 0], hex_points[:, 1], c='green', s=8)
plt.show()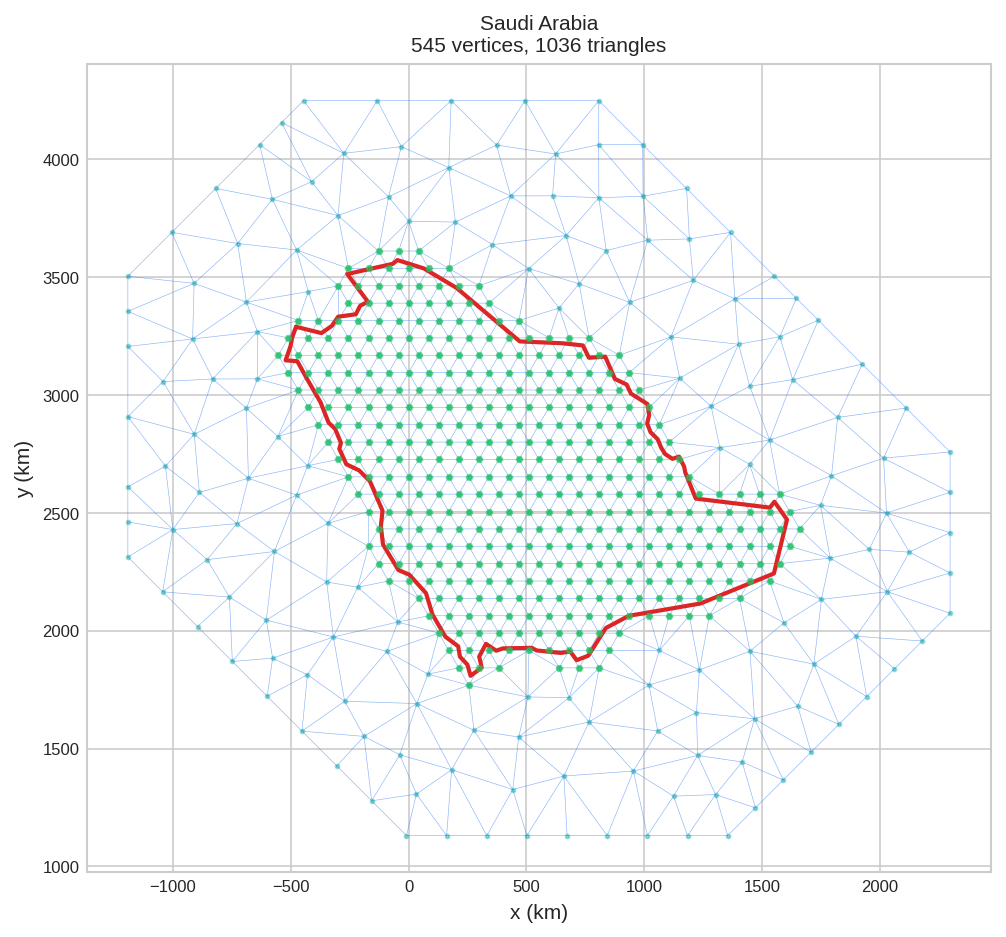
Lebanon
Small country with complex coastline. Hexagon lattice ensures good coverage despite irregular shape.
lebanon = load_country_boundary('Lebanon')
boundary = get_boundary_coords(lebanon)
bounds = lebanon.total_bounds
domain_size = max(bounds[2] - bounds[0], bounds[3] - bounds[1])

# Generate hexagon lattice points inside boundary
edge_len = 0.08 * domain_size  # ~15 km spacing
geo_buffer = 0.1 * domain_size
hex_points = fm_hexagon_lattice(boundary, edge_len=edge_len, geo_buffer=geo_buffer)

# Create mesh from hexagon points
mesh = fm_mesh_2d(
    loc=hex_points,
    offset=0.3 * domain_size,
    max_edge=0.15 * domain_size
)
print(f"Domain: {domain_size:.0f} km, Mesh: {mesh.n} vertices")

# Plot mesh with country border
fig, ax = mesh.plot(title="Lebanon", show=False)
lebanon.boundary.plot(ax=ax, color='red', linewidth=2)
ax.scatter(hex_points[:, 0], hex_points[:, 1], c='green', s=8)
plt.show()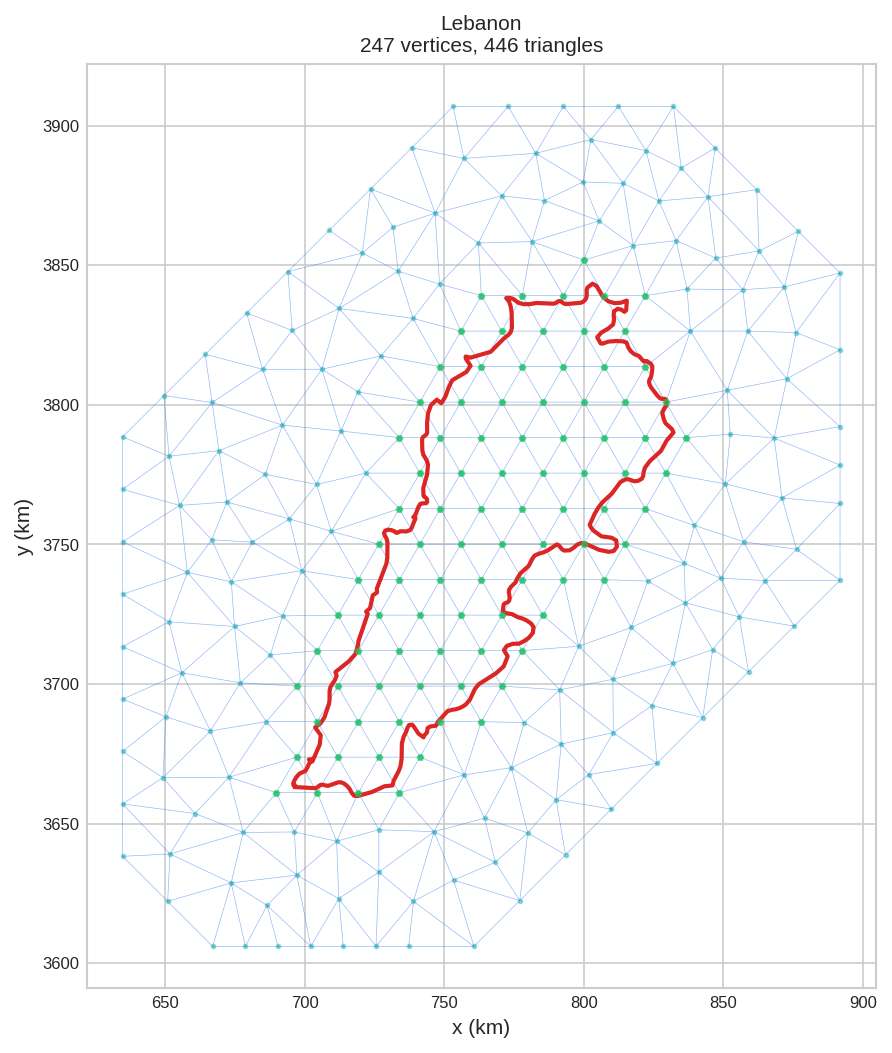
Norway
Long, narrow country with highly irregular coastline (fjords). Hexagon lattice works well for elongated shapes.
norway = load_country_boundary('Norway')
boundary = get_boundary_coords(norway)  # Gets mainland only

# Use boundary coords for domain size (excludes Svalbard/islands)
domain_size = max(np.ptp(boundary[:, 0]), np.ptp(boundary[:, 1]))

# Generate hexagon lattice points inside boundary
edge_len = 0.03 * domain_size  # ~75 km spacing
geo_buffer = 0.05 * domain_size
hex_points = fm_hexagon_lattice(boundary, edge_len=edge_len, geo_buffer=geo_buffer)

# Create mesh from hexagon points
mesh = fm_mesh_2d(
    loc=hex_points,
    offset=0.3 * domain_size,
    max_edge=0.15 * domain_size
)
print(f"Domain: {domain_size:.0f} km, Mesh: {mesh.n} vertices")

# Plot mesh with mainland border
fig, ax = mesh.plot(title="Norway", show=False)
ax.plot(boundary[:, 0], boundary[:, 1], color='red', linewidth=2)
ax.scatter(hex_points[:, 0], hex_points[:, 1], c='green', s=8)
plt.show()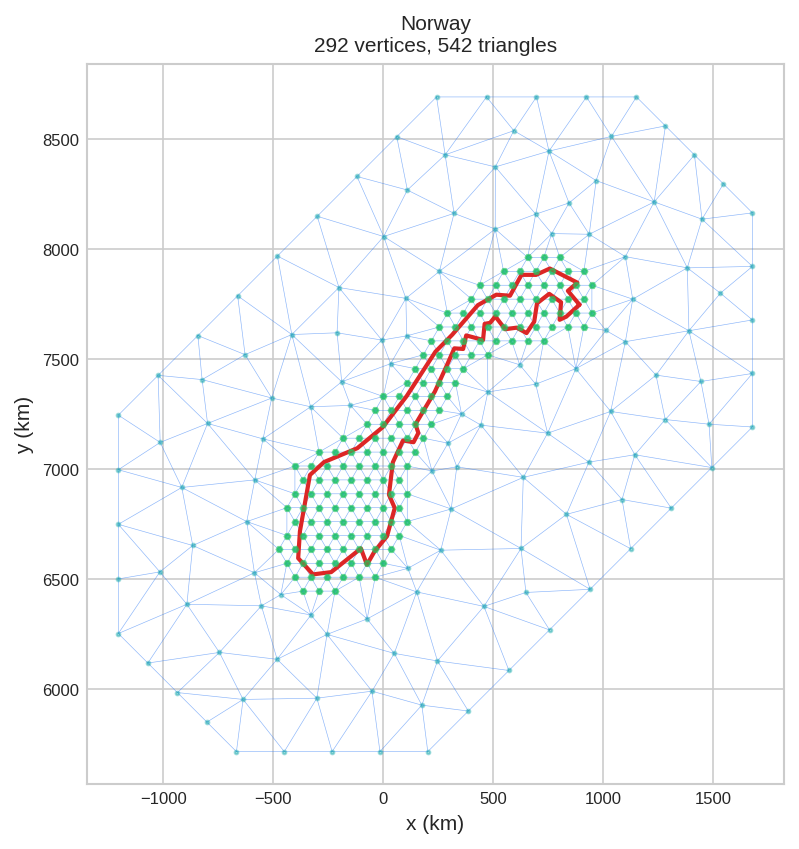
Brazil
Very large country spanning multiple UTM zones. Hexagon lattice provides efficient uniform coverage.
brazil = load_country_boundary('Brazil')
boundary = get_boundary_coords(brazil)
bounds = brazil.total_bounds
domain_size = max(bounds[2] - bounds[0], bounds[3] - bounds[1])

# Generate hexagon lattice points inside boundary
edge_len = 0.025 * domain_size  # ~110 km spacing
geo_buffer = 0.03 * domain_size
hex_points = fm_hexagon_lattice(boundary, edge_len=edge_len, geo_buffer=geo_buffer)

# Create mesh from hexagon points
mesh = fm_mesh_2d(
    loc=hex_points,
    offset=0.3 * domain_size,
    max_edge=0.15 * domain_size
)
print(f"Domain: {domain_size:.0f} km, Mesh: {mesh.n} vertices")

# Plot mesh with country border
fig, ax = mesh.plot(title="Brazil", show=False)
brazil.boundary.plot(ax=ax, color='red', linewidth=2)
ax.scatter(hex_points[:, 0], hex_points[:, 1], c='green', s=8)
plt.show()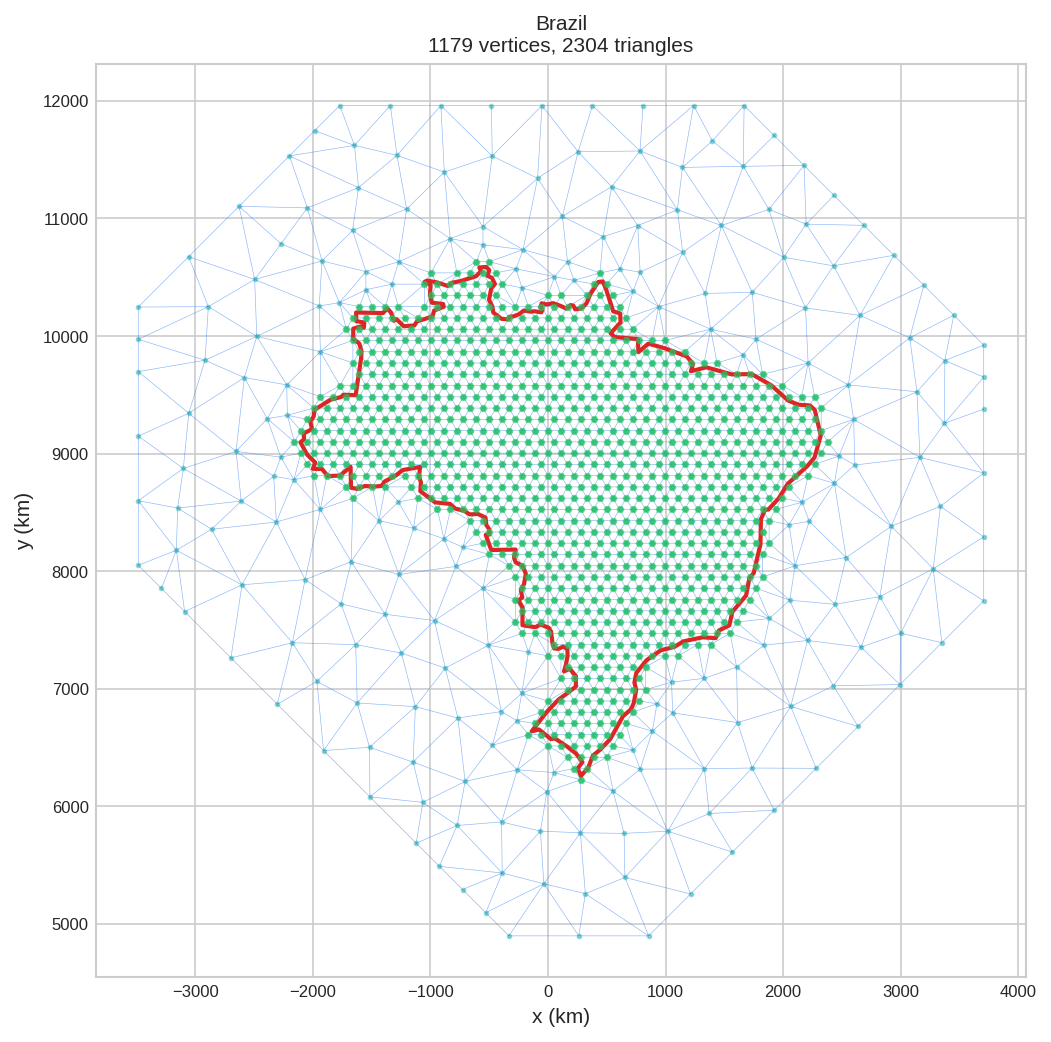
Parameter Guidelines by Country Size
Use domain size as a reference for setting hexagon lattice parameters:
| Country Size | Domain (km) | edge_len | geo_buffer | offset |
|---|---|---|---|---|
| Small (Lebanon, Belgium) | < 500 | 6-10% of domain | 8-12% of domain | 25-35% of domain |
| Medium (Germany, Japan) | 500-1500 | 4-6% of domain | 5-8% of domain | 25-35% of domain |
| Large (Saudi Arabia) | 1500-3000 | 3-5% of domain | 4-6% of domain | 25-35% of domain |
| Very Large (Brazil, Russia) | > 3000 | 2-4% of domain | 3-5% of domain | 25-35% of domain |
edge_len: spacing between hexagon lattice points (controls interior resolution)geo_buffer: padding around boundary for lattice pointsoffset: outer mesh extension (typically 30% of domain for smooth boundary effects)max_edge: typically 15% of domain for the outer coarse triangles
edge_len gives finer resolution but more vertices.
Finding Country Names
Natural Earth uses standard country names. Here's how to search for available countries:
# List all available country names
url = 'https://naciscdn.org/naturalearth/110m/cultural/ne_110m_admin_0_countries.zip'
world = gpd.read_file(url)
print(world['ADMIN'].sort_values().tolist())'Austria', 'Bahrain', 'Bangladesh', 'Belgium', 'Brazil', 'Canada', ...]
- United States of America (not "USA" or "US")
- United Kingdom (not "UK" or "Britain")
- United Arab Emirates (not "UAE")
- South Korea (not "Korea")